

A quantifiable resume metric is a number that shows the scale of your work or the size of its result: money, percentages, volumes, time, team size or budget. It is credible only when a hiring manager can see what you did, what changed and roughly how you know. This guide shows which numbers to use, where to find them when no one tracked your results, and how to place them in bullets that survive an interview.
TL;DR
- Pair every number with an action and a result. A figure with no context reads as decoration.
- Look for frequency, scope, scale or impact: money, targets, people served, volume, time saved, growth, quality, team and budget size.
- If you lack an exact figure, use a conservative range you can explain aloud in an interview.
- Give percentages a baseline wherever possible, and never invent or inflate a number.
- Confidential figures, career gaps and international experience can all be quantified honestly with the techniques below.
Table of Contents
- What counts as a quantifiable achievement
- Metric categories you can draw from
- How to find numbers when no one tracked your results
- Turning a number into a strong bullet
- When the metric is not obvious
- Special situations
- Where to place metrics on the page
- Our perspective on metrics
- Getting help turning your career into numbers
- FAQ
- Sources
What counts as a quantifiable achievement
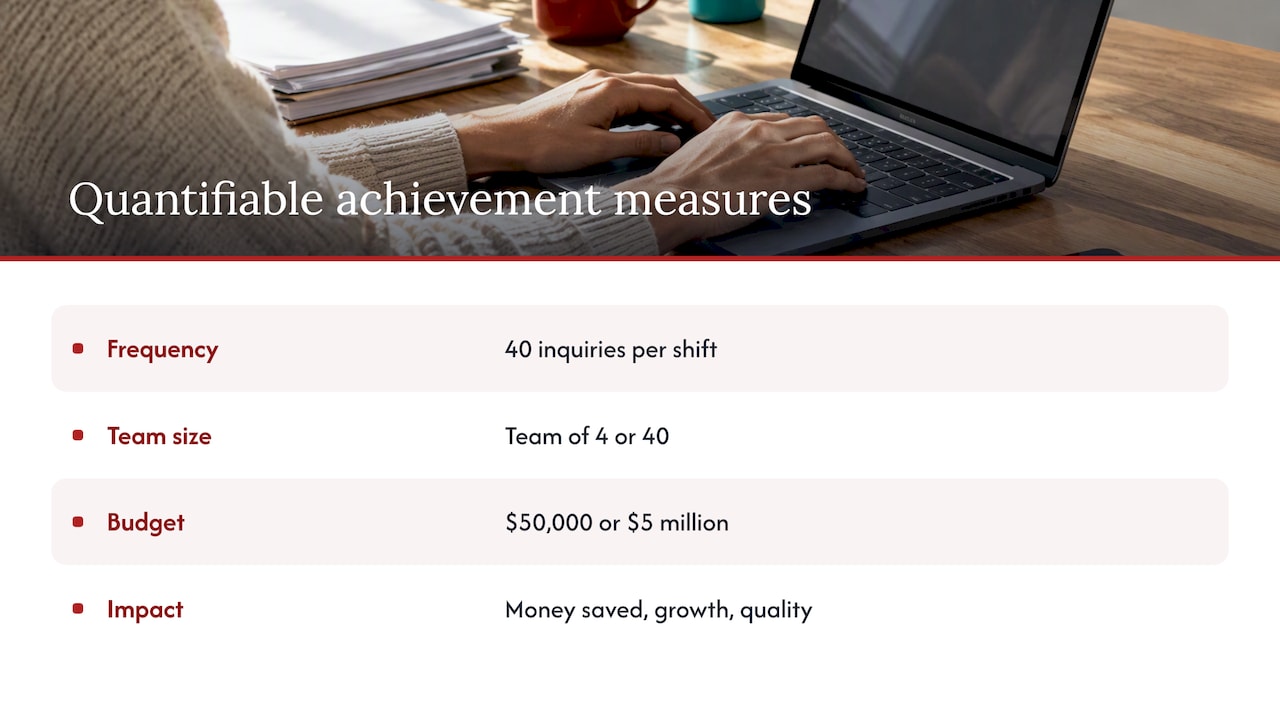
Carleton University’s Career Services describes quantification as showing frequency, scope, scale or impact: money saved or generated, targets met, people served, work volume, time saved, growth, quality, and the size of the team or budget you managed. That list is broader than most job seekers expect. Revenue and cost savings are the obvious entries, but they are only two of nine or so categories.
The reason numbers matter is comparison. “Responsible for customer service” describes a role that thousands of people hold. “Resolved approximately 40 customer inquiries per shift while keeping repeat complaints low” describes a person, with a volume a reader can picture. The number lets a recruiter place you in a scale: a team of 4 or 40, a budget of $50,000 or $5 million, a caseload of 15 or 150.
A useful distinction is between a duty and an achievement. A duty says what the job required. An achievement says what happened because you did it. Numbers can strengthen both, but they are most persuasive on achievements, where they show a difference you made.
Metric categories you can draw from
Before writing any bullet, walk through the categories below for each role. Most people find three or four applicable figures per position they had not thought to include.
| Category | What to look for | Example of a figure |
|---|---|---|
| Money | Revenue, savings, budget managed, cost per unit | “$1.2 million portfolio”, “reduced costs by 10%” |
| Targets | Quota, KPI, service-level goal met or exceeded | “met 112% of annual target” |
| People | Clients, students, patients, customers, direct reports | “supervised a team of 9” |
| Volume and frequency | Transactions, files, shipments, tickets per day or week | “processed 60 files weekly” |
| Time | Turnaround, cycle time, hours saved, deadlines met | “cut report preparation from 5 days to 2” |
| Growth | Increase in sales, membership, traffic, participation | “grew participation from 50 to 100 members” |
| Quality | Accuracy, error rate, satisfaction, audit results | “91% classification accuracy” |
| Scope | Locations, regions, projects, systems, stakeholders | “across 300 retail locations” |
The categories mirror the ones Carleton lists in its guidance on quantifying statements, which also publishes industry handouts covering business, engineering, communications, computing, government, human services, legal and compliance, research, retail, teaching and UX, among others.
Metrics by role type
The right numbers depend on how your function is judged.
- Sales and business development: revenue closed, quota attainment, pipeline value, accounts retained, deal size, new accounts opened.
- Operations and supply chain: cost per unit, cycle time, on-time delivery rate, inventory accuracy, stockout frequency, utilization.
- Finance: portfolio size, forecast variance, close-cycle duration, audit findings, budget under management.
- Marketing and communications: audience growth, conversion rate, campaign budget, leads generated, engagement rates.
- People and human resources: time to fill, retention, employees supported, training participants, onboarding duration.
- Healthcare and human services: caseload, patients or clients per shift, compliance rates, wait-time changes, programs delivered.
- Education: class size, students supported per week, program enrolment, assessment results where you can state them.
- Data and technology: system uptime, tickets resolved, models built, dashboards delivered, accuracy, precision and recall, plus the business outcome they produced.
For technical roles, Carleton’s data science, AI and ML bullet-point guide recommends pairing technical outputs with business outcomes such as cost, stockouts, utilization, scalability and productivity. If your background is in this area, our guide to a data analyst resume with project-style bullets shows the same logic applied to Canadian postings.
How to find numbers when no one tracked your results
Most people do not carry a dashboard of their own performance. The numbers are usually recoverable, though, if you look in the right places.
- Performance reviews and feedback. Shared Services Canada advises applicants to identify accomplishments from work, school, projects and volunteer experience, and to consult evaluations, feedback and any awards or praise tied to their contributions. Review letters often contain a target, a rating or a client comment that holds a figure.
- Reports you produced or received. Monthly summaries, sales reports, project closeouts and budget files typically contain the exact baseline and result.
- Calendars and ticket systems. Count what you handled in a typical week, then multiply or state the weekly rate.
- Colleagues and former managers. A short message asking “what was our year-end result on that project?” is normal and often answered quickly.
- Before-and-after memory. Ask what was true before you arrived or acted, and what was true after. The gap is your result.
What to do when you only have an estimate
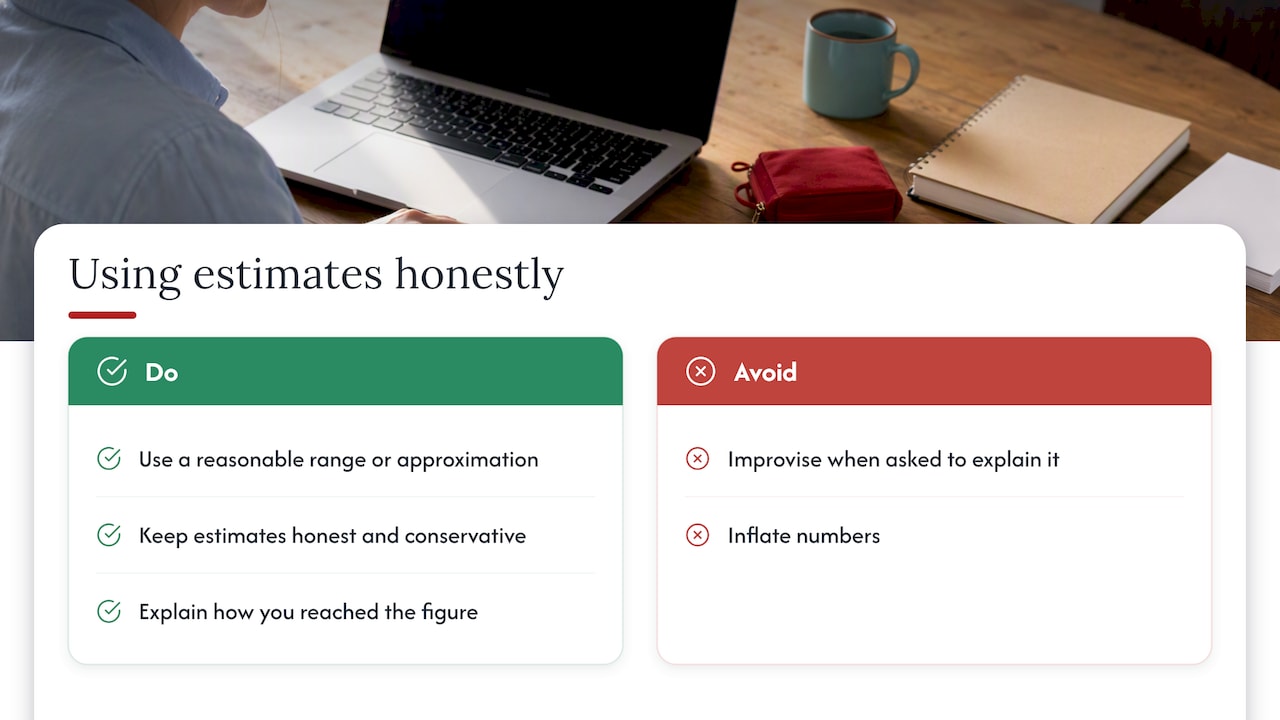
Carleton’s guidance is direct on this point: if you do not know the exact number, use a reasonable range or approximation based on what you know, and keep it honest, conservative and explainable in an interview. Its examples include “15 to 20 students per week”, “10+ projects” and “approximately 50 customers per shift”.
A practical test: could you walk an interviewer through how you arrived at the figure in two sentences? If yes, it belongs. If you would have to hedge or improvise, lower it or leave it out.
Honesty is also strategically sound. A meta-analysis of 27 studies reported by CERIC found that deceptive impression management had almost no association with interview evaluations, while honest self-presentation was associated with better ones. Inflated numbers add risk without adding reward.
Turning a number into a strong bullet
A number alone is not a bullet. The structure that works across the guidance we reviewed is consistent: a strong verb, the situation or project, the action, and the result with its figure.
Carleton frames this as situation, action and result. Yale’s career office recommends an Action, Project, Result structure and the formula “Accomplished X as measured by Y by doing Z”, with the result measured numerically where possible. EURES, the European job mobility network, similarly suggests treating each achievement as a short story: the task, the skills and actions, the business benefit, supported by facts and figures such as reduced costs, increased sales or improved efficiency.
Here is the formula applied to weak bullets:
| Duty-only bullet | Quantified version |
|---|---|
| Managed office supplies | Reorganized a cluttered office supply store, leading to a 20% increase in merchandise sales |
| Analyzed transit data | Analyzed data from 50 bus routes and reduced forecasting error by 16% compared with prior averaging methods |
| Helped run a student club | Led a five-person team that increased participation from 50 to 100 members |
| Worked on inventory | Reduced stockouts by 21% across 300 retail locations |
The first and second rows come from Carleton’s SAR guide and its data science handout; the club and stockout figures come from Yale’s bullet guide and the same Carleton handout. Adapt the structure, not the numbers. Your own figures must be your own.
For more worked patterns, see our article on resume achievement examples using the PAR format.
Add a baseline to every percentage
A percentage alone can mislead. “Improved performance by 12%” raises the question: from what? St. Olaf’s career guide shows the better approach, stating a 12% portfolio improvement alongside the dollar amount it represented, then explaining the method. Yale makes the same point when it says the strongest bullet includes a baseline or comparison.
Practical ways to give a percentage weight:
- State the starting and ending points: “from 50 to 100 members”, “from five days to two”.
- Attach the dollar or unit value: “a 12% gain on a $1.2 million portfolio”.
- Name the scope: “across 300 retail locations”, “among 35 teams”.
- Name the comparison: “versus prior averaging methods”.
When the metric is not obvious
Some of the strongest work resists clean numbers: improving a process, stabilizing a team, handling a sensitive file. You still have options.
- Count the inputs. Number of stakeholders, departments, systems, countries or regulations involved.
- Count the frequency. “Weekly”, “daily”, “for every quarterly close” shows regularity and reliability.
- Use rank or selection. Yale’s examples include being selected among 230 nationwide participants, which gives context to an award or role.
- Use duration. Years in a role, length of a project, months to launch.
- Describe scope without revenue. Team size, budget range, number of sites or the number of people affected by a policy.
The Public Service Commission of Canada’s leadership assessment, for instance, looks at context, the candidate’s role and behaviours, and the impact produced during complex challenges. That is a useful mental model for any achievement without a tidy percentage: show the difficulty, your part, and what changed.
Metrics need context, not worship
Numbers can also be over-trusted. The tri-agency CV guidance from Canada’s research funders says that quantitative indicators should be provided with context and not used in isolation, and that reviewers should look beyond counts of publications, citations or grants. The principle carries over to any resume: a metric supports a narrative of quality and relevance, and does not replace it. Choose the two or three figures that matter most to the role, rather than adding a number to every line.
Special situations
Confidential figures
If your employer treats revenue, client names or contract values as confidential, you can still show scale without disclosing sensitive data. Use ranges (“a seven-figure budget”), proportions (“grew regional revenue by about a fifth”), relative rank (“the top-performing territory of six”) or scope (“across four provinces”). Where an exact number is restricted, state that you can discuss detail in an interview, and be prepared to do so within what your confidentiality obligations allow.
Returning after a career gap
A gap does not erase the numbers from your earlier roles, and volunteer, freelance, caregiving-related projects and training can carry figures too: hours volunteered weekly, funds raised, clients served, courses completed. CareerWise, the Canadian career development resource, has listed material explaining that a career break can read differently in an applicant tracking system than on LinkedIn, which is a good reason to keep dates and achievements clear in both places. Our guide to ATS-friendly resumes for Canadian job seekers covers formatting; we make no claim that numbers alone change how any system ranks a file.
Experience from outside Canada
Employers here may not recognize the scale of a foreign company or institution. Translate it: give headcount, annual revenue in Canadian dollars with the original currency if helpful, the number of branches, the size of the market served. Replace local titles with the closest Canadian equivalent and let the numbers carry the seniority.
Federal government applications
Government screening works differently from private-sector reading. Shared Services Canada notes that claiming experience does not prove a qualification; applicants should give concrete examples of how they performed the work, including years, employer and dates where relevant. Numbers help, but so does narrative detail. We cover this in more depth in our guide to federal resumes in Canada.
Where to place metrics on the page
Numbers are most effective in three locations:
- The career summary. One or two headline figures set the scale immediately: years of experience, team or budget size, a signature result. See our guide to writing a career summary that impresses Canadian recruiters.
- The first bullets under each recent role. Readers scan the opening lines first, so lead with your strongest quantified result.
- Your LinkedIn profile. The same figures should appear consistently, so your resume and profile corroborate each other.
A final test for every bullet: remove the number and see whether the bullet still says something. If it does not, rewrite the action. If the number alone carries the line, add the context.
Our perspective on metrics
We write for executives, healthcare professionals, engineers, finance specialists and career changers, and the same pattern appears in nearly every first draft we receive: strong careers described through duties, with the figures left in the client’s head. The consultation is where those figures surface. A client who says they “ran the department” can usually tell us within minutes the headcount, the budget, the turnaround before and after, and the change they led.
Our approach is to treat numbers as evidence for a story. For an executive, that means P&L ownership, transformation led and organizational outcomes stated at a scale a board would recognize. For an early-career candidate, it means volume, frequency and reliability, since revenue figures may not exist. In both cases, the number must be defensible. We would rather place a conservative figure the client can explain than a bolder one that collapses under a single interview question.
We also advise restraint. Three well-chosen metrics per role are stronger than ten scattered ones, and a resume that is all statistics reads as thin on judgment. Work directly with your writer to decide which figures serve the role you want next.
— Professional
Getting help turning your career into numbers
If you have the experience but struggle to surface or phrase the figures, a consultation-led writing service can shorten the process. At Professional Resumes, you work directly with a writer who draws out your results, checks them against what you can support, and builds them into an ATS-friendly document. Published prices are one-off: the Early Career Resume is $139, the Next Step Resume is $189, the Advanced Resume is $239 and the Executive Resume is $289. You can compare them on our shop page, and our LinkedIn profile optimization service keeps your profile consistent with the numbers on your resume.

FAQ
Is it acceptable to estimate numbers on a resume?
Yes, when the estimate is honest and conservative. Carleton University recommends a reasonable range or approximation if you lack an exact figure, such as “approximately 50 customers per shift”. Make sure you can explain in an interview how you reached it.
How many numbers should a resume bullet contain?
One or two is usually enough. A bullet that stacks four figures becomes hard to read and obscures the result. Choose the number that best shows scale or impact, and add a baseline if it is a percentage.
What if my job has no measurable results?
Most jobs have some measurable dimension even when results are not tracked: volume, frequency, people served, turnaround, team size or number of stakeholders. Check performance reviews and ask former colleagues. Where nothing is available, describe scope and context in plain terms rather than inventing a figure.
Should I include KPIs from my previous employer if they are confidential?
Use ranges, proportions or relative rank rather than exact amounts, and describe scope, such as the number of provinces or sites. Avoid anything your confidentiality agreement prohibits, and be ready to discuss only what you are permitted to share.
Do numbers help a resume pass an applicant tracking system?
We do not claim that they do. Numbers make your achievements clearer to the human reader who follows the system. For formatting that keeps your content readable by these systems, see our guide to ATS-friendly resumes.
Sources
- SAR Statements, Carleton University Career Services
- Writing Strong Resume Bullet Points: Data Science, AI and ML, Carleton University
- Writing Impactful Resume Bullets, Yale Office of Career Strategy
- My Personal Formula for a Winning Resume, St. Olaf Piper Center
- How to write an achievements-focused CV, EURES
- Tips and tricks to apply for a job at Shared Services Canada
- Leadership Achievement and Situational Assessment, Public Service Commission of Canada
- Tri-agency CV: Frequently asked questions, SSHRC
- The truth will set you free: why deception is not an effective strategy in job interviews, CERIC
- Resources to support parents returning to work after a career break, CareerWise